The visual report
One self-contained HTML file: a to-scale timeline for every event, drawn from frame data, with analytics on top and the evidence one click below. Zero external requests; it opens offline by double-click. Add --embed-audio and the exact scored clip lands inside the file too; a report built that way carries whatever was said on the call, so share it with the same care as the raw recording.
# score a recording and render the report
uvx hotato report --stereo call.wav --out report.html

# the bundled self-test battery, same page
uvx hotato report --suite barge-in --out selftest.html

# the same content as Markdown tables
uvx hotato report --stereo call.wav --format md --out report.md

# opt-in: embed the exact scored audio in the file too (HTML only, ~8 MB cap)
uvx hotato report --stereo call.wav --embed-audio --out report.html
What the page shows
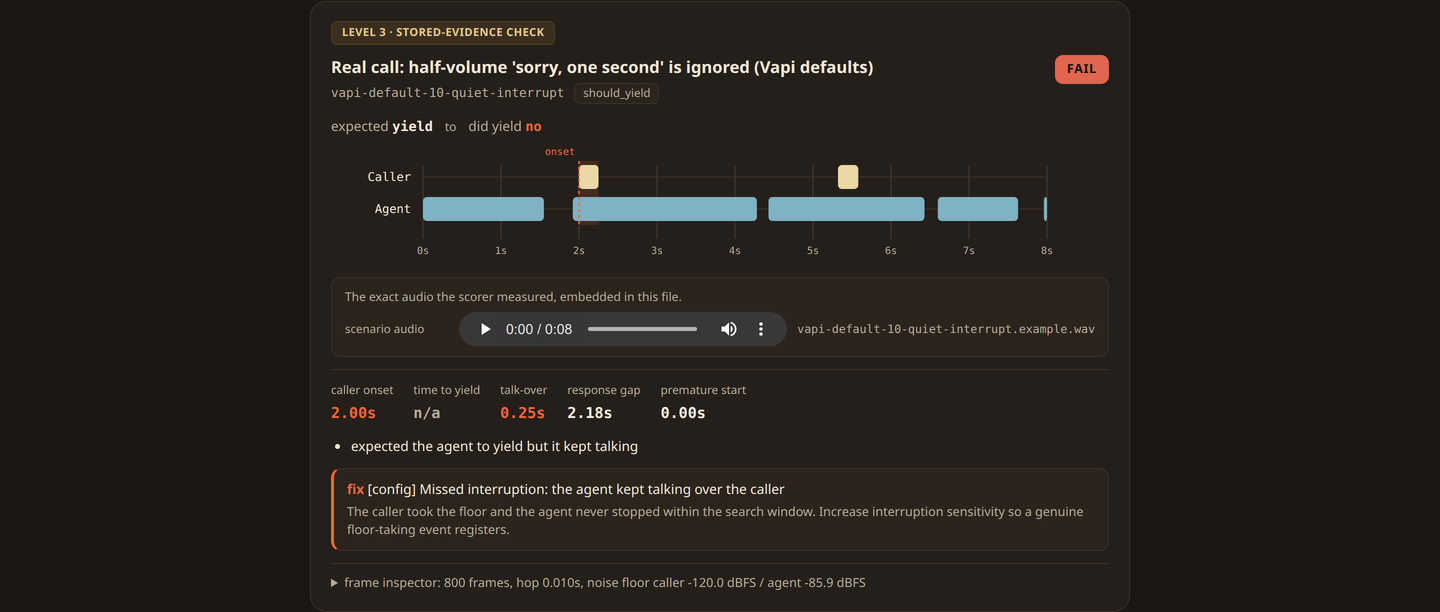
- A per-event SVG timeline: caller and agent activity to scale, the overlap shaded, the caller-onset and yield markers, the measured talk-over seconds, expected vs actual, and a PASS or FAIL chip. An event whose input cannot be judged gets a NOT SCORABLE chip with its reason instead of a verdict.
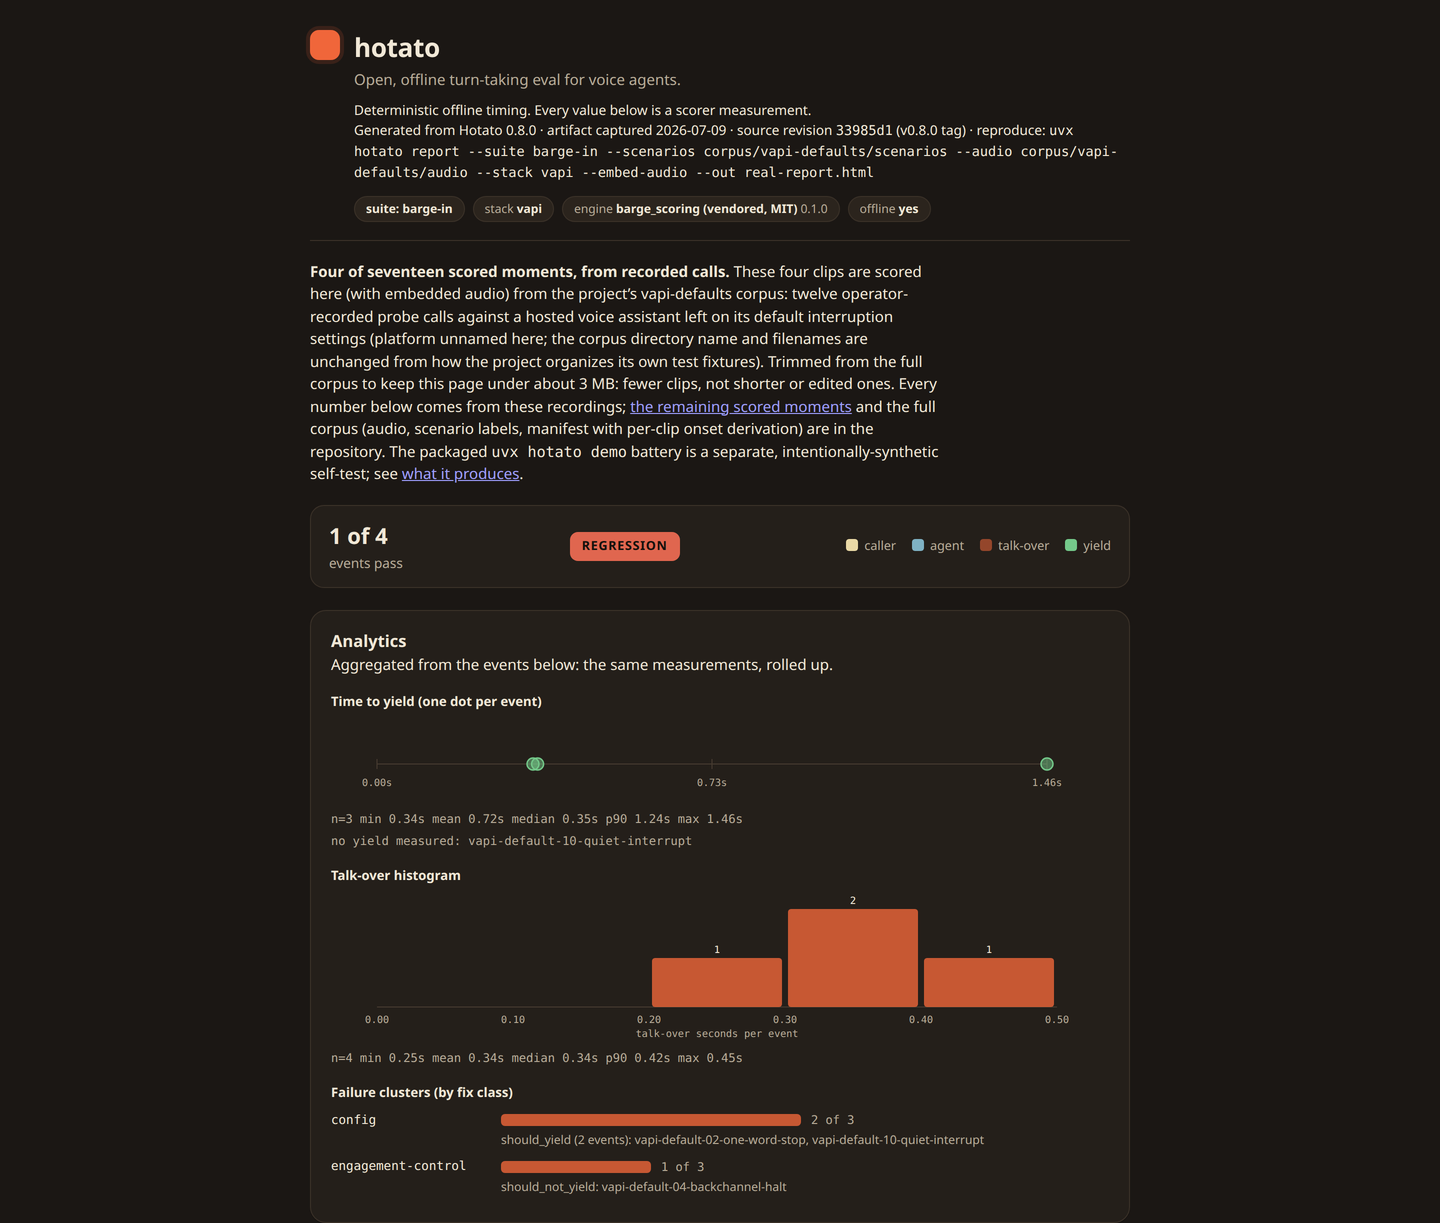
- Analytics from the same measurements: a time-to-yield distribution strip (one dot per measured yield, with mean, median, and p90), a talk-over histogram on a fixed grid, and failure clustering by fix class. A page with fewer than three events skips this rollup; there is nothing left for it to say.
- A collapsible frame inspector per event: the full frame dump as a table (
t_sec, per-channel dBFS, active flags, thresholds), so every pixel on the page is re-derivable by hand. - Thresholds used, once: every
ScoreConfigvalue and VAD parameter, collapsed into one closed panel at the end of the page, so the run stays reproducible without repeating the same table over every event.
ScoreConfig thresholds sit once, in a closed panel at the end of the page.The page renders the envelope; it computes nothing new. Counts appear as fractions like 8 of 8, never a percentage; p90 is linear interpolation; there is no accuracy score anywhere. Definitions: METHODOLOGY.md.
Regression deltas with --base
Save an envelope, then compare a later run against it. The report renders per-scenario talk-over and time-to-yield deltas with clear worse and better marks.
hotato run --suite barge-in --format json > base.json
# ... change a prompt, a config knob, a model ...
hotato report --suite barge-in --base base.json --out report.html
The page ships print CSS. Print it from any browser and the interactive parts collapse into a clean paper layout, so print-to-PDF is the PDF export.
One command instead: hotato doctor
The 5-minute path. Pass a recording and it scores it, embeds that recording's audio in the report by default, and opens it in your browser; with no recording it runs the bundled self-test, unembedded. On a headless box it prints the path.
uvx hotato doctor --stereo call.wav   # score your call, open the report
uvx hotato doctor                     # self-test fallback, same flow
uvx hotato doctor --demo --no-open --out report.html
0 all pass, 1 a regression (--no-fail forces 0), 2 usage or I/O error. The report is a CI artifact that doubles as the gate.